AIMS
Showing the effects of applying certain circular strategies to a given linear product, in terms of its changing LCA profile.
WHAT IT CONSISTS OF
- Defining the linear product system.
- Defining a circular scenario and comparing results.
HOW TO USE THE TOOL
- Create a new project.
- Define the reference product by entering a functional unit (FU) and a Product Carbon Footprint.
- Click “SAVE PCF” and move on “IMPROVE”
- In “ASSESSMMENT”: Seeing what is defined as the Maximum Circular Value Capture (MCVC). The MCVC shows the shares of life cycle stages that can be influenced by applying a circular strategy.
- Click on the strategy names, for example: Circular Sourcing. When selecting it, the tool highlights the related strategies in the other web tools (CE Designer and CE Strategist). Click on the blue
- Modeling the impacts of the circular scenario. Each strategy unlocks a different set of variables dependent on the characteristics of the strategy. Assessing the circular value capture when applying the circular sourcing strategy
- Click “SAVE ASSESSMENT” and move on “RESULTS”
- After clicking on “results”, check the comparison of the carbon footprint of the reference scenario with the modelled scenario.
- Export the results or save them to apply another strategy and repeat Step5 and Step6. On the left sidebar, it could see the product history. The different product iterations are automatically named according to the applied strategy.
- Applying another strategy, restarts the process with the MCVC. The input values are now slightly different, due to changed input variables.
- The strategy “unlocks” two variables related to the influence on the lifetime of the product and the use intensity. Assuming that the period is 35 days per year, and the life time shortens by 30% through the intensified use. Click “SAVE”
- Check on the left right bar how the factors influence the carbon footprint.
- If not unsure about how the new scenario is calculated, the formulas are documented in the Help dialog.
- Once finalized the strategy application, comparing different product iterations, by clicking on the + on the left side bar next to “comparisons”. It could choose any two products to compare.
- The tool then shows the results of the different versions, as well as the applied strategies and the product history.
- Once new comparisons are added, they can also be exported as pdf-files. After clicking on “export” and choosing the related project it could choose which elements should be included in the pdf, which is automatically generated.
RESULTS
The results show the estimated effects of applying one or more circular strategies on the Product Carbon Footprint.
TO VIEW THE TUTORIAL : https://www.katche.eu/knowledge-platform/wp-content/uploads/2020/03/CE-Analyst-Tutorial.pdf
TO VIEW AND DOWNLOAD THE TOOL : https://www.katche.eu/knowledge-platform/tools-and-training-materials/katch_e-tools/ce-analyst/
Product Processes and stages
PSS Processes and stages
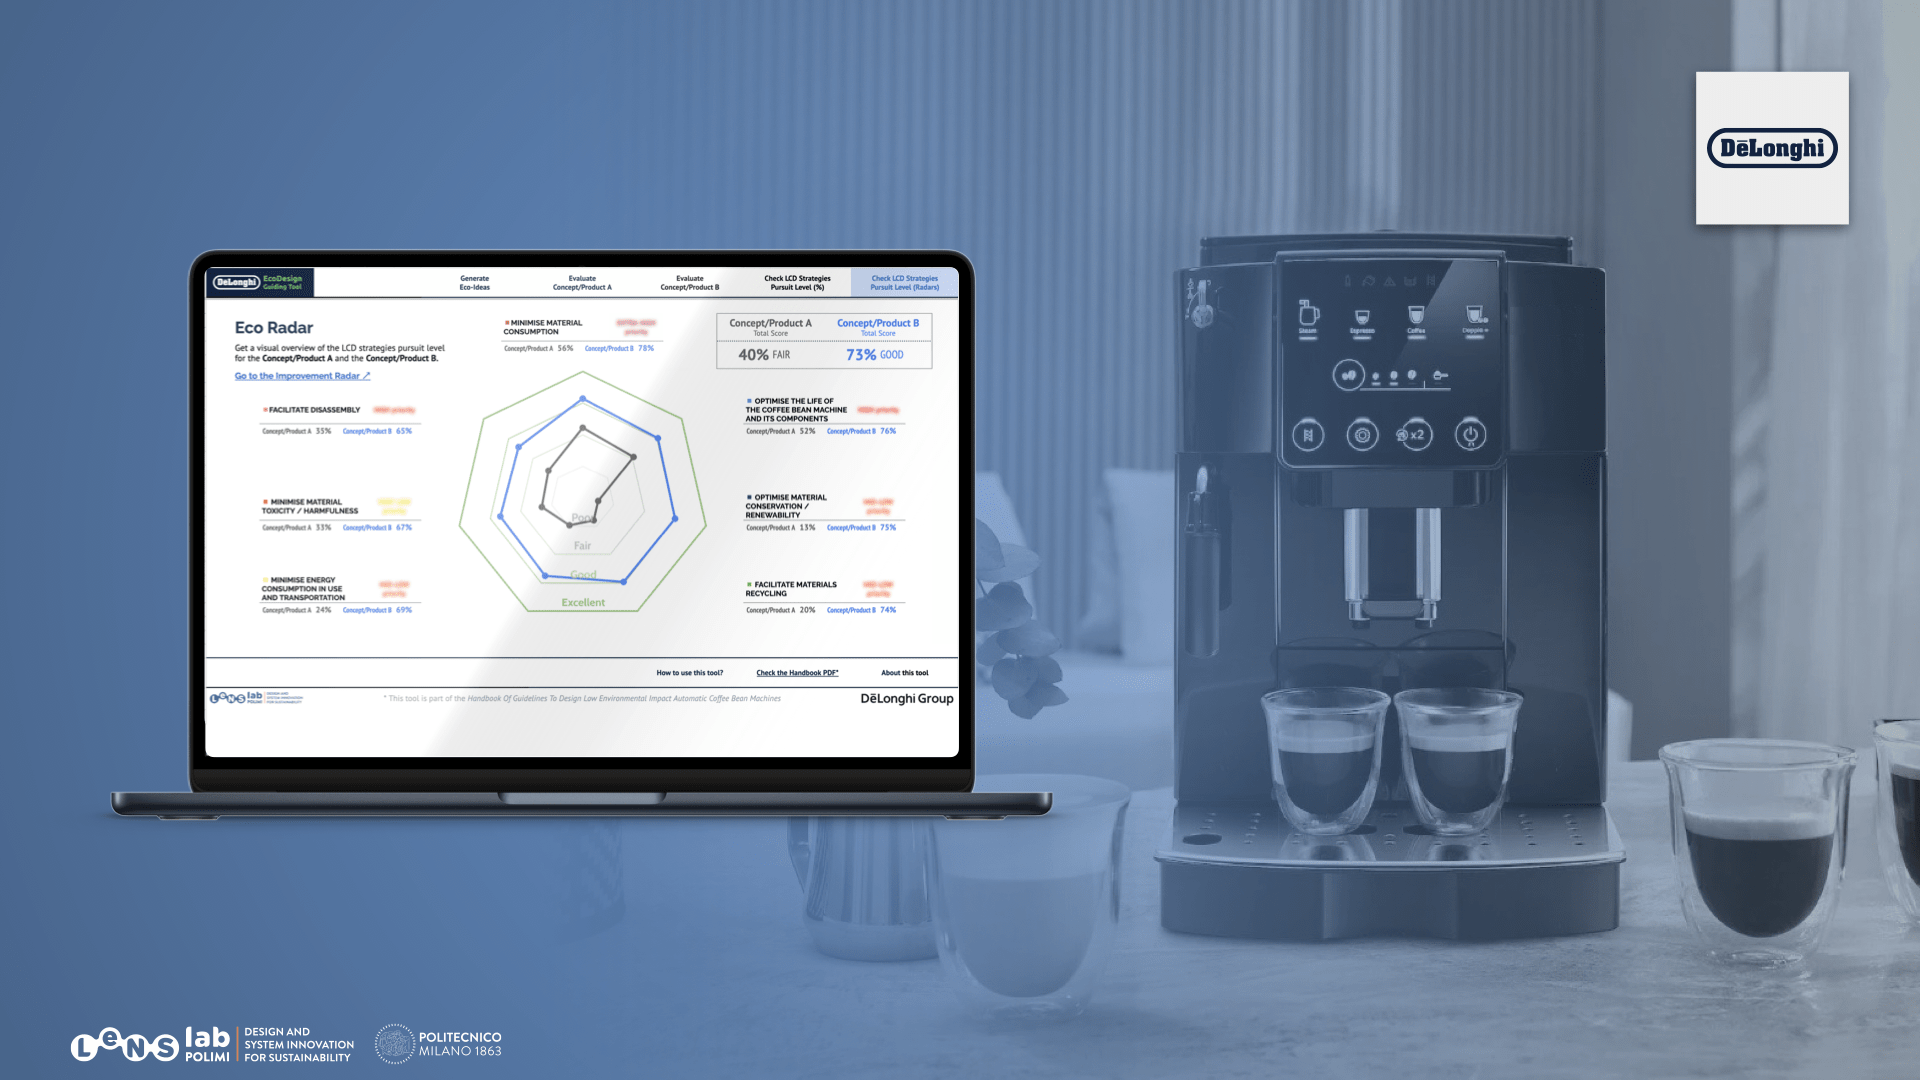
- LCD strategies priorities definition (Product strategic brief/Design brief)
- Sustainable-focused ideas generation, selection and clustering (Product concept design)
- Environmental features + simplified LCA or qualitative concept evaluation (Product concept design)
- Simplified LCA or qualitative concept evaluation(Product concept design)
- LCA of comparison with original product or qualitative evaluation (Product detailed design and engineering)
- Documentation for communication for environmental quality (Product communication)
- Sustainability analysis of the existing PSS (Service strategic analysis/design brief)
- Definition of PSS design sustain. priorities (Service strategic analysis/design brief)
- Generation of sustainability oriented ideas for PSS (Service concept design)
- Environmental, socio ethical and economic check (Service concept design, Service detailed design & engineering)
- Documentation for communication of sustainable qualities (Service communication)